

پاراگراف مقدمه برای دسته اول نمودارها2
IELTS Reports Group 1 – Introductory Paragraph – Part 2
اگر قسمت اول این مقاله را نخوانده اید، ابتدا به سراغ آن مطلب بروید.
پاراگراف مقدمه برای دسته اول نمودارها2
برای نوشتن یک پاراگراف بدون کلیشه باید این بخش ها را با همدیگر ترکیب کنیم و یک پاراگراف Introduction غیر کلیشه ای بنویسیم:
The bar chart displays the proportion of Iranian Instagram users between 2014 and 2017 in three groups in which teenagers’ use rocketed in the last year.
این نوشته می تواند بهترین پاراگراف Introduction باشد که شما می توانید آن را در رایتیتنگ تسک 1 آیلتس آکادمیک بنویسید.
به سراغ یک Sample واقعی آیلتس می رویم. این Sample در کمبریج آیلتس 9 آمده بود:
Writing Task 1
You should spend 20 minutes on this task.
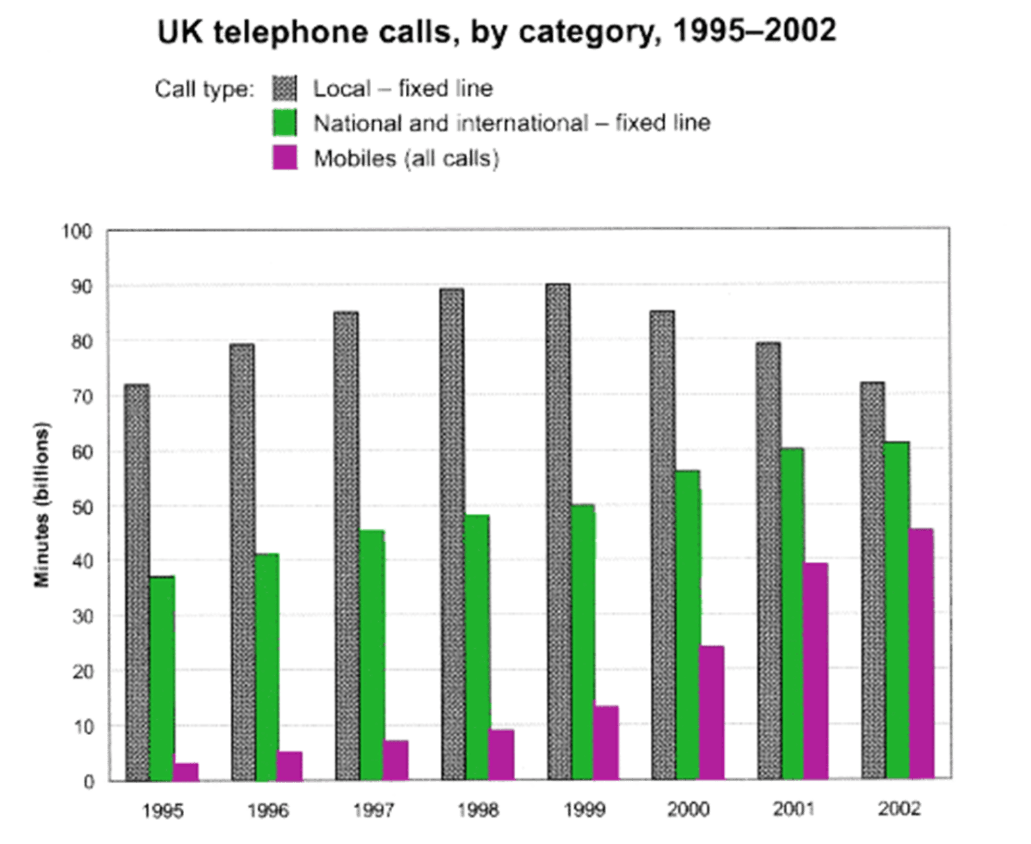
The chart below shows the total number of minutes (in billions) of telephone calls in the UK, divided into three categories, from 1995-2002. Summarize the information by selecting and reporting the main features, and make comparison where relevant.
در ابتدا صورت سوال را Paraphrase می کنیم:
The bar chart shows the amount of time British people spent on various phone calls, over a seven-year period of time between 1995 and 2002.
در اینجا می توانیم بخش هایی را Paraphrase کنیم یا معادل های دیگری برایشان بیاوریم. مثلا به جای Bar chart بگوییم The given visual یا The diagram. به جای فعل Show می توانیم از واژه های Illustrates ،Indicates یا Depicts استفاده می کنیم. همچنین برای بخش Amount of time British people spent می توانیم از The time British people spent /How much time people from UK spent /How the British spent time استفاده کنیم. برای Between 1995 and 2002 از /From 1995 to 2002 /Over a seven-year Time scale /In 7 years’ time, From 1995-2002 استفاده می کنیم.
در اینجا باید مراقب فعل Show باشید! اگر نمودار شما جدول باشد، فقط می توانید از فعل های Give information، Show و Represent استفاده کنید. برای مثال شما از فعل Illustrates که به معنای به تصویر کشیدن است، نمی توانید برای Table استفاده کنید.
خب! پس بعد از بخش Opening Statement که با هم خواندیم یک Switcher ارائه می دهیم، یک Observation Phrase می آوریم و پس از آن Overview را می نویسیم.
اما Overview ما دراین سوال چیست؟ اگر دقت کنید در این نمودار زمانی که مردم UK تلفنی با هم تماس داشتند به سه دسته تقسیم شده است. Local- Fixed Line، بیشترین استفاده را در طول این دوره داشته است. یک Overview دیگر که شاید بتوان به آن گفت Big Picture، این است که موبایل، مخصوصا در انتهای دوره بیشترین افزایش را به خود اختصاص داده است. بنابراین می توانیم یکی از این نکات را به عنوان Overview مطرح کنیم. به این پاراگراف Introduction نگاه کنید:
The bar chart shows the amount of time British people spent on various phone calls, over a seven-year period of time between 1995 and 2002. Overall, it can be seen that local – fixed line was used the most throughout the period.

کلیشه ها در پاراگراف مقدمه برای دسته اول نمودارها2
باز هم با ایموجی ضدکلیشه مواجه شدید! مجددا یادآوری می کنیم که اگر قرار باشد بخش های قبلی را پشت سر هم به هم وصل کنیم، پاراگراف Introduction ما حالت کلیشه ای پیدا خواهد کرد. پس باید چه کار کنیم؟ بخش های مختلف را با هم ترکیب می کنیم و یک پاراگراف Introduction فوق العاده می نویسیم:
The given chart shows the amount of time British people spent on various phone calls, local – fixed line standing out among them, over a seven-year period of time between 1995 and 2002.
مشاهده می کنید که بخش Overview و Opening Statement را با هم ترکیب کردیم و یک نمونه غیر کلیشه ای نوشتیم.
چند Sample برای تمرین بیشتر
در ادامه چهار Sample جهت تمرین بیشتر برای شما ارائه شده است.
Sample شماره 1:
Writing Task 1 – Sample 01
You should spend 20 minutes on this task.
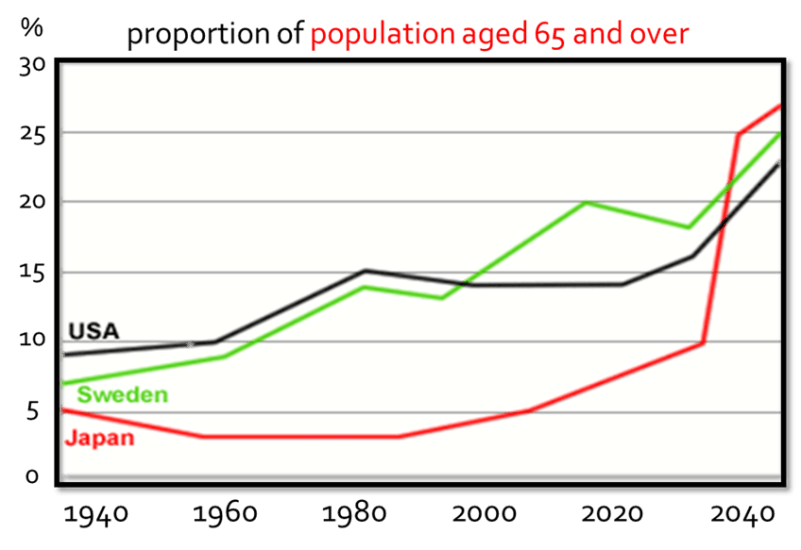
The graph below shows the proportion of population aged 65 and over among the USA, Sweden and Japan.
Summarize the information by selecting and reporting the main features, and make comparison where relevant.
Sample شماره 2:
Writing Task 1 – Sample 02
You should spend 20 minutes on this task.
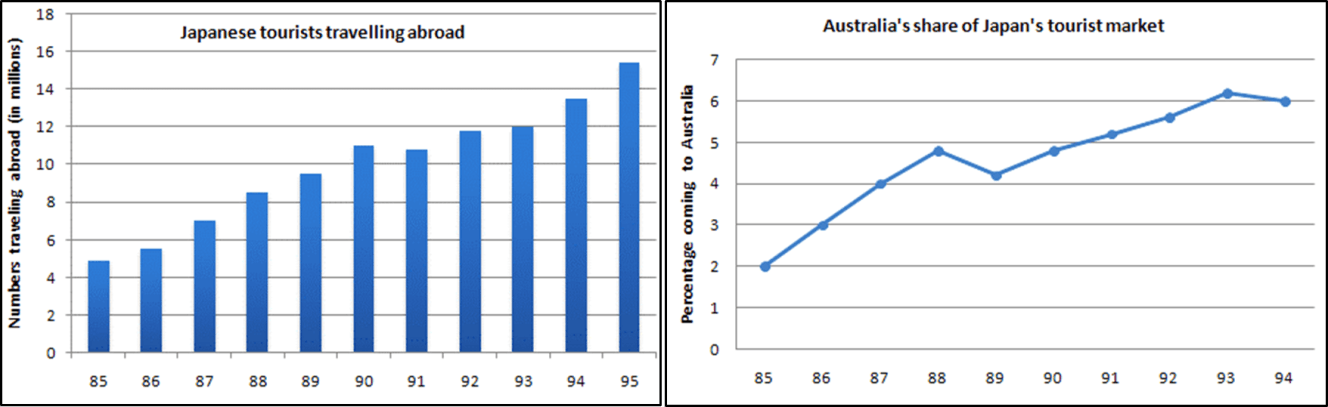
The charts below show the number of Japanese tourists travelling abroad between 1985 and 1995 and Australia’s share of the Japanese tourist market.
Sample شماره 3:
Writing Task 1 – Sample 03
You should spend 20 minutes on this task.
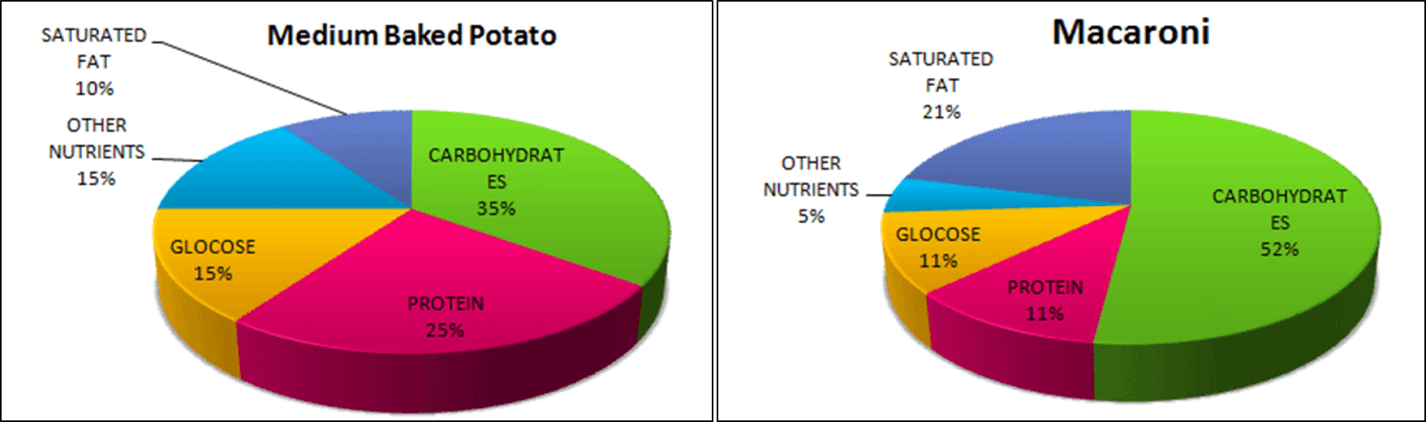
The pie graphs show the nutritional consistency of two dinners.
به Sample چهارم توجه کنید:
Writing Task 1
Sample 04 you should spend 20 minutes on this task.
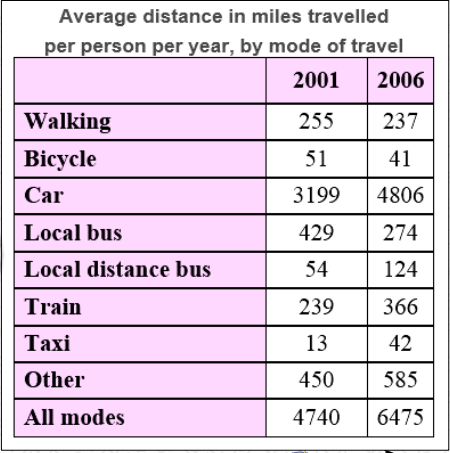
The table below gives information about changes in modes of travel in Netherland between 2001 and 2006.
یک نمونه کلیشه ای دیگر!
نوشته زیر یک نمونه کلیشه ای برای این Sample است:
The given table provides us with the distance travelled by per person per year from 2001 to 2005. On the whole, it is noticeable that in this period, people travelled more in all 8 modes of movements except the first two.
همان طور که مشاهده می کنید، این نوشته یک ساختار کلیشه ای دارد. برای اینکه نوشته را از حالت کلیشه ای دربیاوریم، باید بخش های مختلف آن را با همدیگر ترکیب کنیم. یک Sample بدون کلیشه حد و مرزی ندارد. ما به تمامی مطالب اشاره می کنیم. صورت سوال را بازنویسی می کنیم، نمودار را معرفی می کنیم، Overview می دهیم و … اما اینکه مطالب به صورت Mechanical و کلیشه ای مطالب پشت سر هم آورده شوند، صحیح نیست. بلکه باید ترکیبی از این بخش ها با هم آمیخته شوند. به این نمونه غیر کلیشه ای توجه کنید:
In a five-year period from 2001, clearly the distance travelled (in miles) both the average and each item alone in all modes except the first two climbed according to the data presented in the given table.
سوال می پرسیم!
- برای اینکه پاراگراف Introduction ما کلیشه ای نباشد، چه کارهایی باید انجام بدهیم؟
اگر بتوانید به این سوال کامل و صحیح پاسخ بدهید، یعنی مطالب این مقاله اکسیری را به خوبی متوجه شده اید. از دوره انلاین رایتینگ ایلتس غافل نشوید.
پاراگراف مقدمه برای دسته اول نمودارها2


هیچ دیدگاهی نوشته نشده است.